Skip to content

Influenza

Melbourne Maths and Science Meetup

Last night I gave a talk about Mathematical models of infectious disease transmission (slides) at the Melbourne Maths and Science Meetup. I used my stochastic SIR demo to simulate disease outbreaks amongst the audience — each audience member was assigned a unique number and had to stand up while they were infectious — and it's definitely something I'd like to try in a classroom setting. I was asked very good and challenging questions throughout the talk, and on several occasions my reply was "that's a great question, and I'll talk about that a bit later on". It was a fun night and a chance to meet some great people! Now I'm looking forward to being in the audience at their next event.
No single-biggest roadblock

"It is difficult to make predictions, especially about the future" — this famous quote is a great opening line when discussing infectious disease forecasting. I used it in my talk at the Australian Influenza Symposium (1-2 Nov 2017), as did a speaker in an earlier session. And there are many reasons why infectious disease forecasting is hard. There isn't a single-biggest roadblock to making accurate epidemic forecasts, and I was recently quoted about this very matter in "How Bad Will the Flu Season Get? Forecasters Are Competing to Figure it Out" (The Scientist, 28 Nov 2017).

I really enjoy the challenge of engaging with non-academic audiences, both as an end in itself, and also because it should help me improve my grant writing. And this isn't my first experience with the media. I've previously been quoted in articles about the link between climate and influenza transmission (Flu outbreaks are subject to humidity — not just heat, Cosmos, 1 Nov 2016), and our collaboration with the Victorian Department of Health and Human Services (Defence scientists' bio attack detector could predict flu outbreaks, Herald Sun, 14 Jul 2016).

Epidemic forecasts as a tool for public health

Infectious disease forecasting has been a very active research area in the past few years, and these methods have the potential to provide valuable decision-support capabilities for public health staff. There are many challenges that must be surmounted before this can be realised, and one major gap in the literature is operational research in pilot, real-world applications. We report on exactly this kind of study in our most recent forecasting paper, "Epidemic forecasts as a tool for public health: interpretation and (re)calibration", which has just been made available online and will appear in an upcoming issue of the Australian and New Zealand Journal of Public Health.

Disease surveillance: no silver bullet

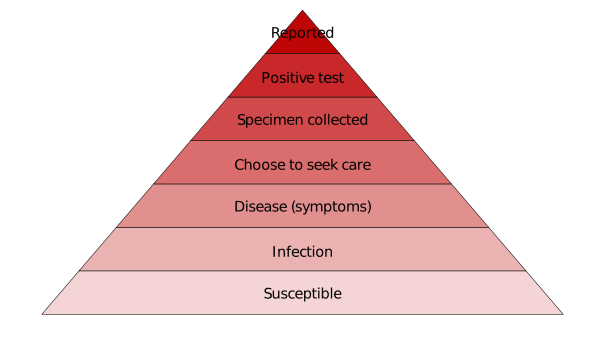
In thinking about the strengths and limitations of different surveillance systems — from the perspective of infectious disease forecasting in my case, but the point applies more generally — it becomes clear that there is no silver bullet. No one surveillance system will tell us everything we need to know in order to understand the current impact of a disease on a population, or to predict the future impact of a disease. The surveillance pyramid model illustrates this in a very nice and clear manner:

Surveillance pyramid

Figure 1: the (infectious disease) surveillance pyramid.

Model selection for seasonal influenza forecasting

Two firsts in one: "Model selection for seasonal influenza forecasting" is Alex's first first-author and my first last-author paper. It will appear in an upcoming issue of Infectious Disease Modelling, a new open access journal with a focus on the interface between mathematical modelling, data analysis, and public health decision support.

This paper presents a likelihood-based method for selecting models that best predict future data (when conditioned on past data), and uses it to evaluate the predictive skill of disease transmission models that incorporate various features, such as inhomogeneous population mixing and climatic effects on transmission. I won't say any more here; if you're interested, read the paper!

The source code used to generate all of the results presented in this manuscript is available under the BSD 3-Clause license.

Interactive SEIR model

Originally prepared as a simple demo for 2016 Open Day, this interactive model allows the viewer to explore how a variety of epidemiological parameters affect the size and duration of an infectious disease epidemic, such as:

  • The basic reproduction number \(\left(R_0\right)\), the average number of persons that a single infectious individual will infect in an entirely susceptible population;
  • The delay between being infected and becoming infectious \(\left(\frac{1}{\alpha}\right)\);
  • The duration for which an individual is infectious \(\left(\frac{1}{\gamma}\right)\);
  • The duration for which an individual is protected from re-infection \(\left(\frac{1}{\sigma}\right)\);
  • The degree to which individuals mix inhomogeneously \(\left(\eta\right)\); and
  • The proportion of the population \(S(0)\) that is initially susceptible.

This is a deterministic SEIR meta-population model, where each individual in the population is either susceptible to infection, has been exposed to the pathogen, has progressed to being infectious, or has recovered from infection and has (temporary or permanent) protection from reinfection.

The source code is available under the BSD 3-Clause license.

A week is a long time in politics

A year has passed since my last post, and much has happened. I contributed to 6 government reports, submitted 5 first-author papers, became a reviewer for 4 more journals, gave 3 talks about our influenza forecasting project, enrolled 2 jurisdictions in our forecasting project, and joined 1 surveillance system. Here is the 2015/16 financial year recap …